Canvas & Visualization
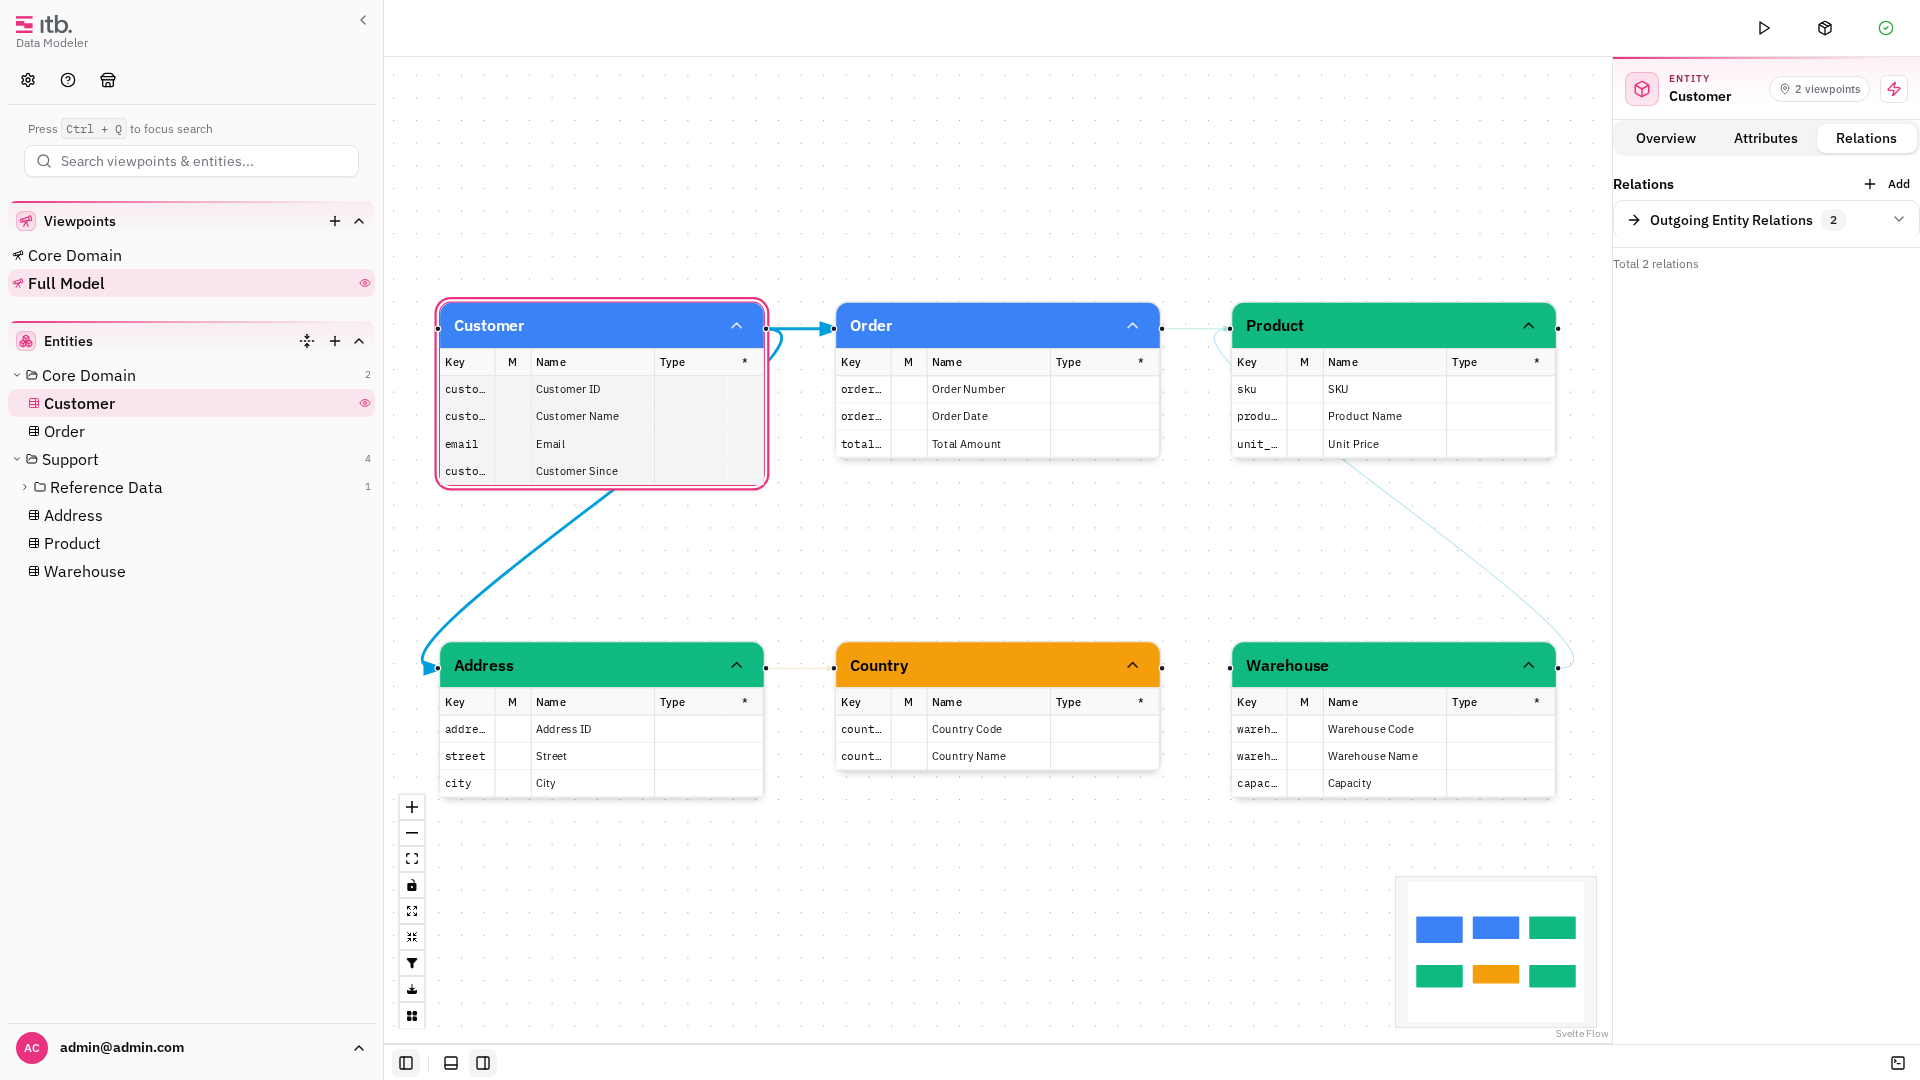
The canvas is the central workspace where you see and interact with your data model as a visual graph.
Pan and Zoom
- Pan — click and drag an empty area of the canvas. The pan mode can be changed in Settings → Canvas (Default, Selection, or Middle-click).
- Zoom — scroll the mouse wheel, or use the + / − buttons in the canvas controls.
- Fit View — click the fit-to-view button in the canvas controls to center all entities.
Minimap
The minimap is a small overview panel in the corner of the canvas. Toggle it on or off under Settings → Canvas → Show Minimap.
Auto-Layout
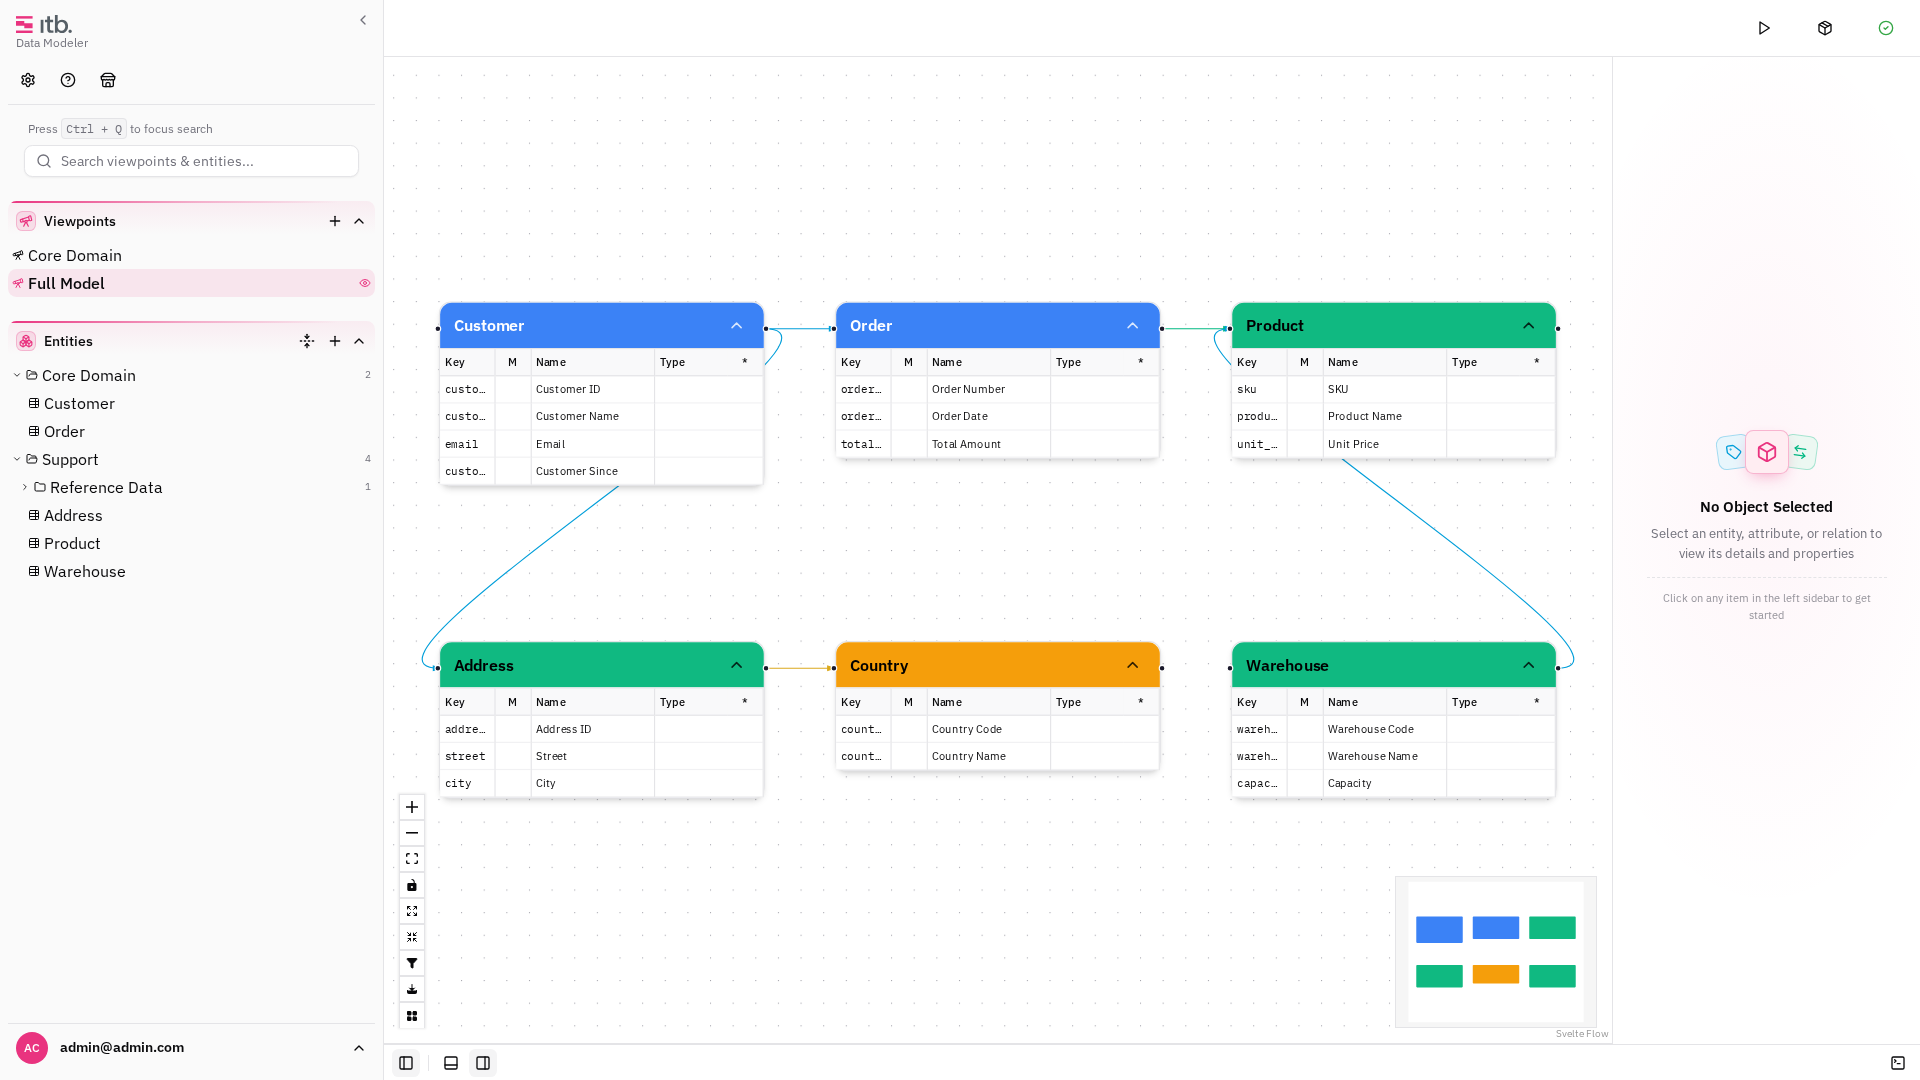
Click the Arrange button in the canvas controls to automatically position entities using one of the available layout algorithms:
| Layout | Description |
|---|---|
| Layered | Hierarchical, layered positioning (default) |
| Force | Force-directed — connected entities attract, unconnected repel |
| MrTree | Tree-based layout for hierarchical models |
| Radial | Circular positioning around a center |
| Stress | Stress-minimization for balanced spacing |
| Box | Rectangular grid arrangement |
After arranging, the view automatically fits to show all entities.
Entity Type Filtering
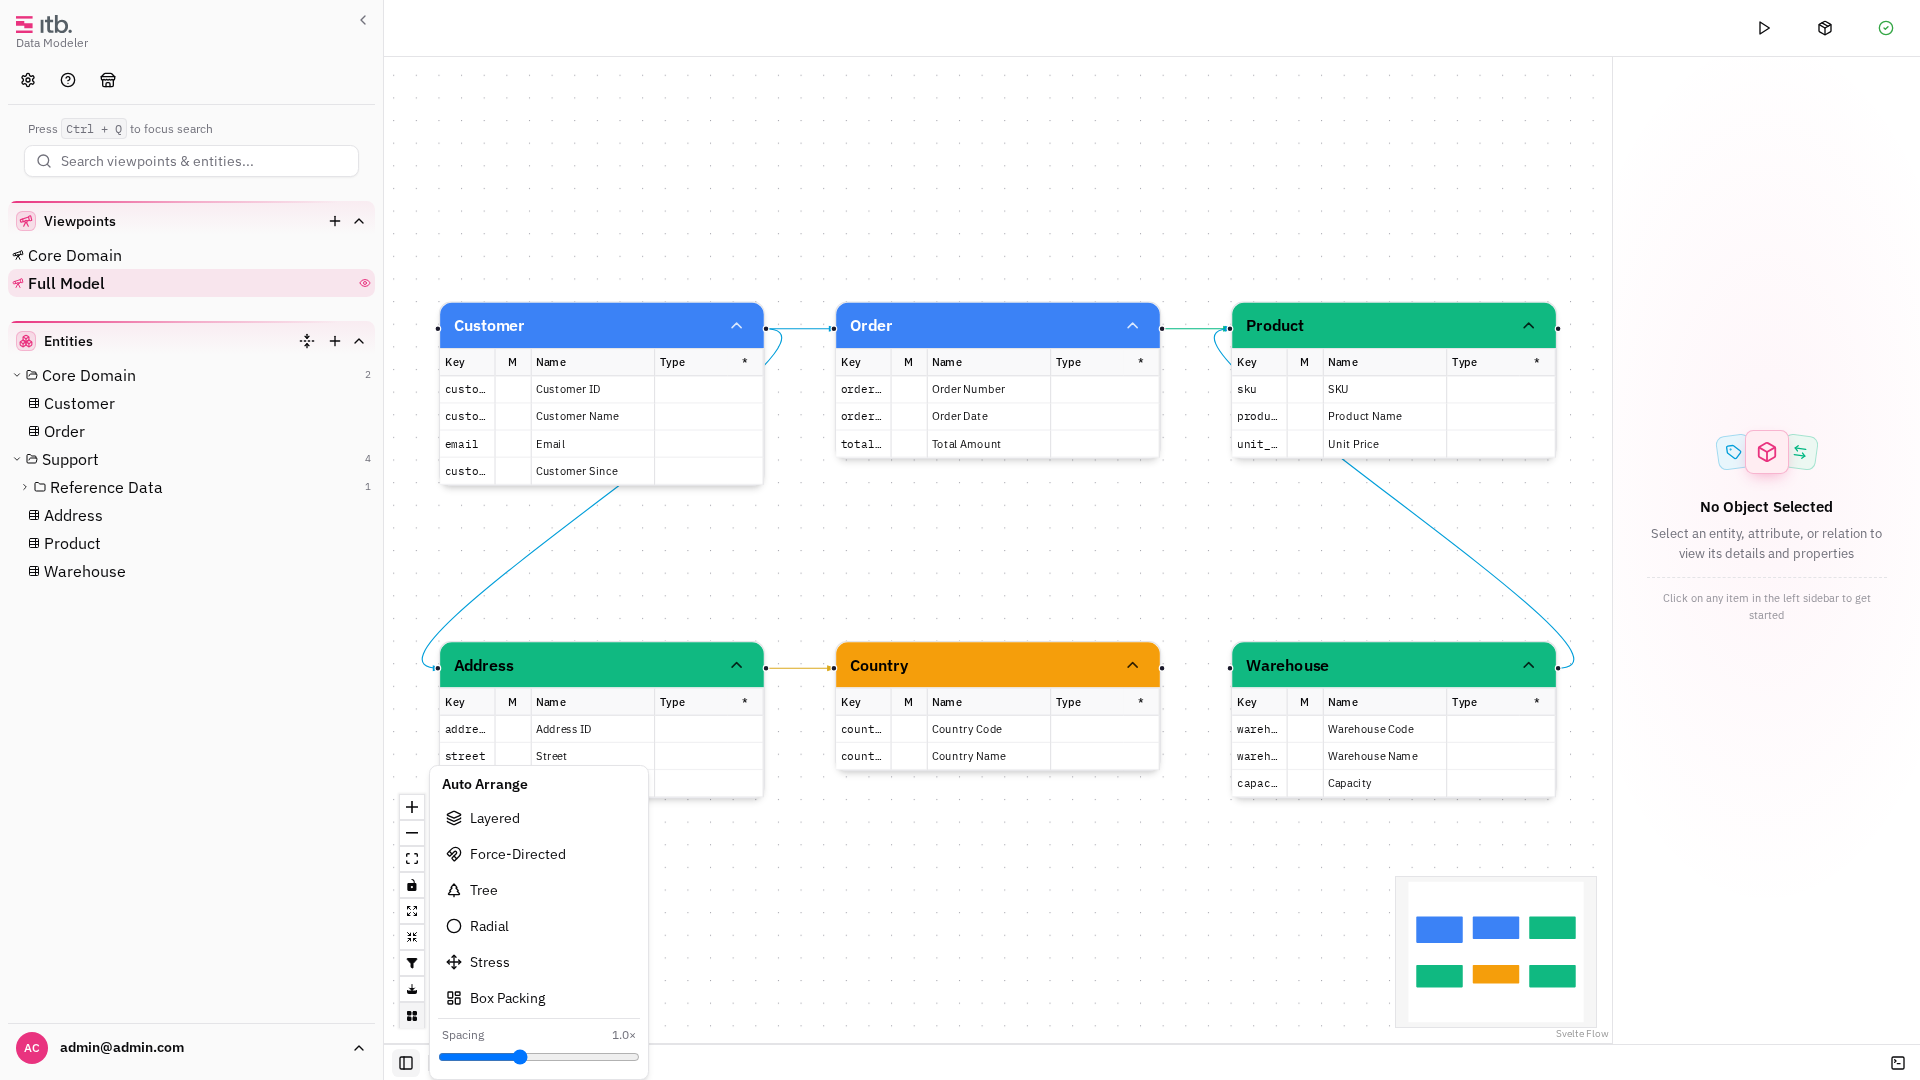
Use the Filter button (funnel icon) in the canvas controls to show or hide entities by type. A badge on the button indicates how many filters are active.
Toggle each entity type on or off. The filter shows the type's color swatch and name for easy identification.

Image Export
Export the current canvas view as an image file:
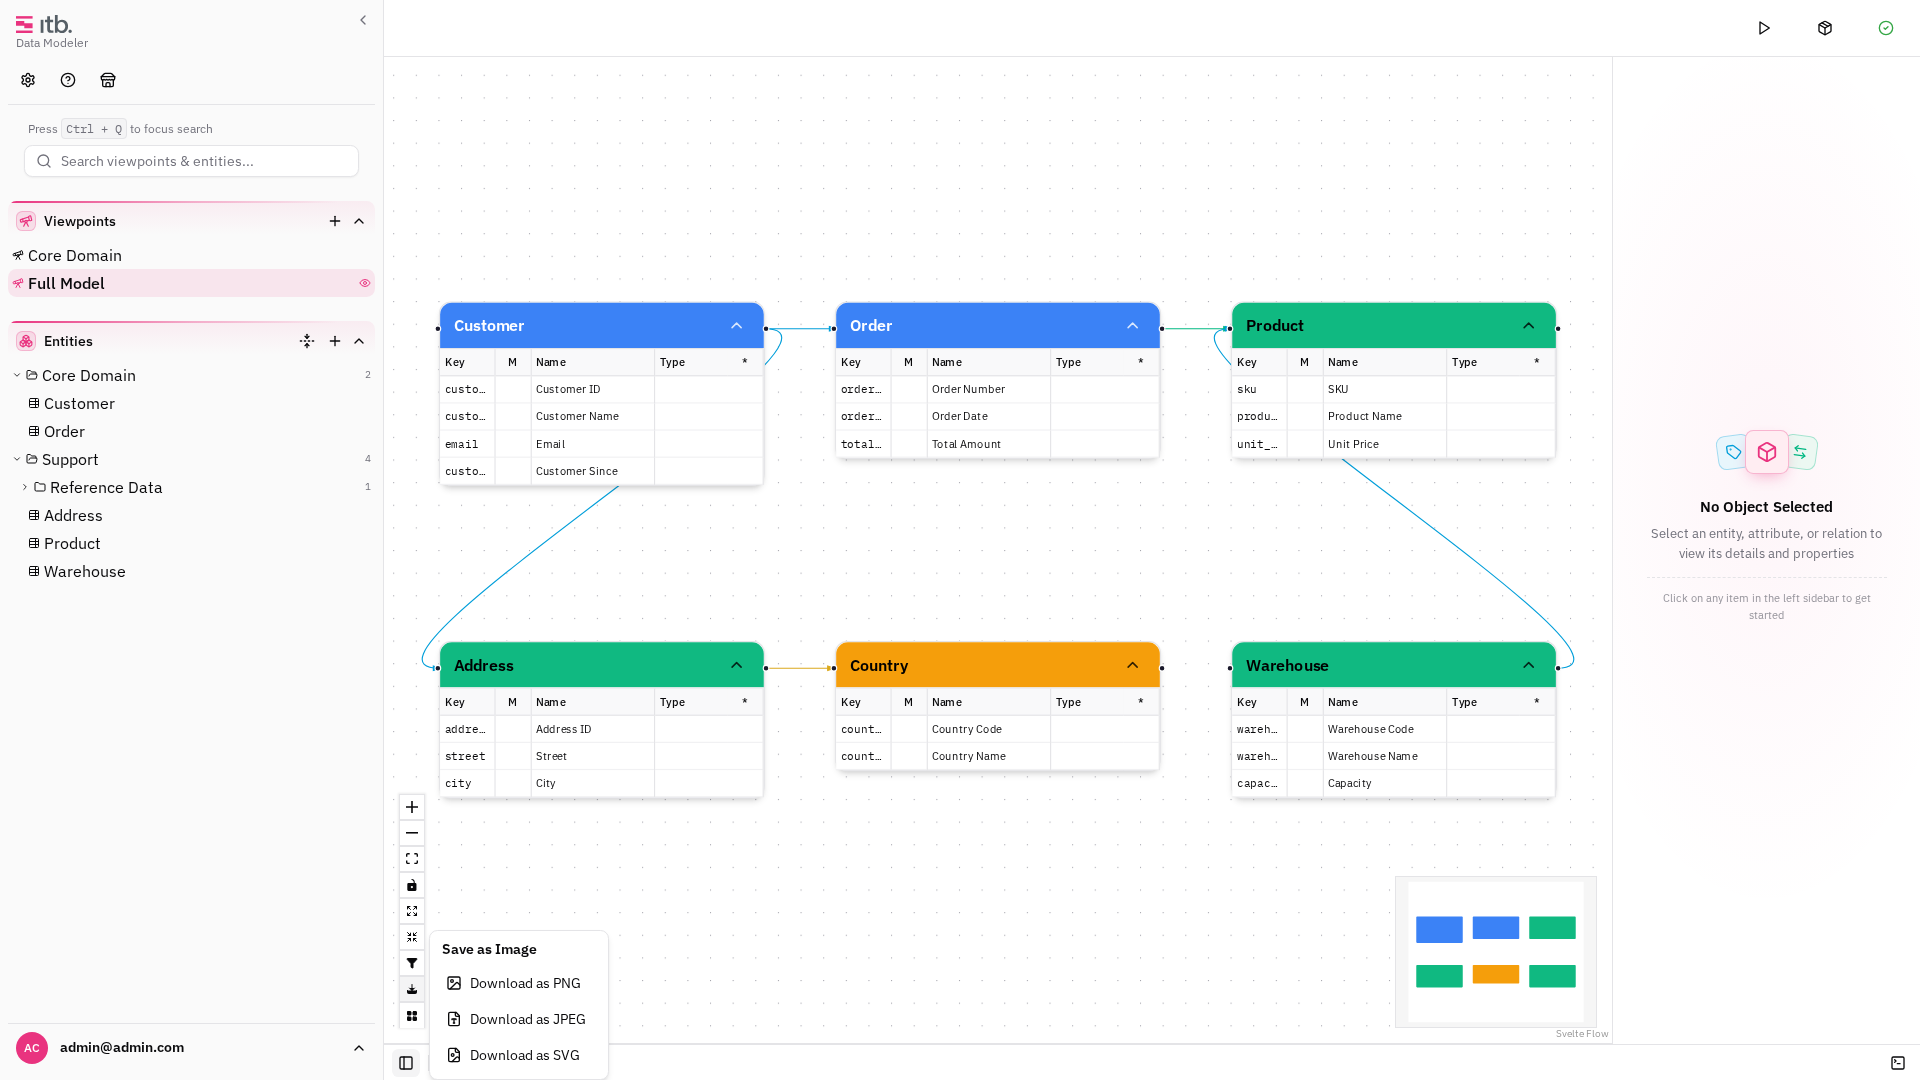
- Click the Save Image button in the canvas controls.
- Select a format:
| Format | Resolution | Notes |
|---|---|---|
| PNG | 2048 × 1536 | Transparent background |
| JPEG | 2048 × 1536 | White background |
| SVG | Vector | Scalable, ideal for documentation |
The image is downloaded as diagram.png, diagram.jpeg, or diagram.svg.
Canvas Background
Choose between four background styles under Settings → Canvas → Background:
- Dots — subtle dot grid
- Lines — horizontal and vertical lines
- Cross — crosshatch pattern
- None — blank background
Edge Highlighting
When you click an entity on the canvas, its connected relation edges are highlighted in their original color with increased stroke width. All other edges are dimmed, making it easy to trace an entity's connections.